 Aura: Looksmaxxing
Looksmaxxing Chart: How to Actually Read It
What a looksmaxxing chart is actually measuring, how PSL scoring is derived, and how to read one without letting it become a verdict on you.
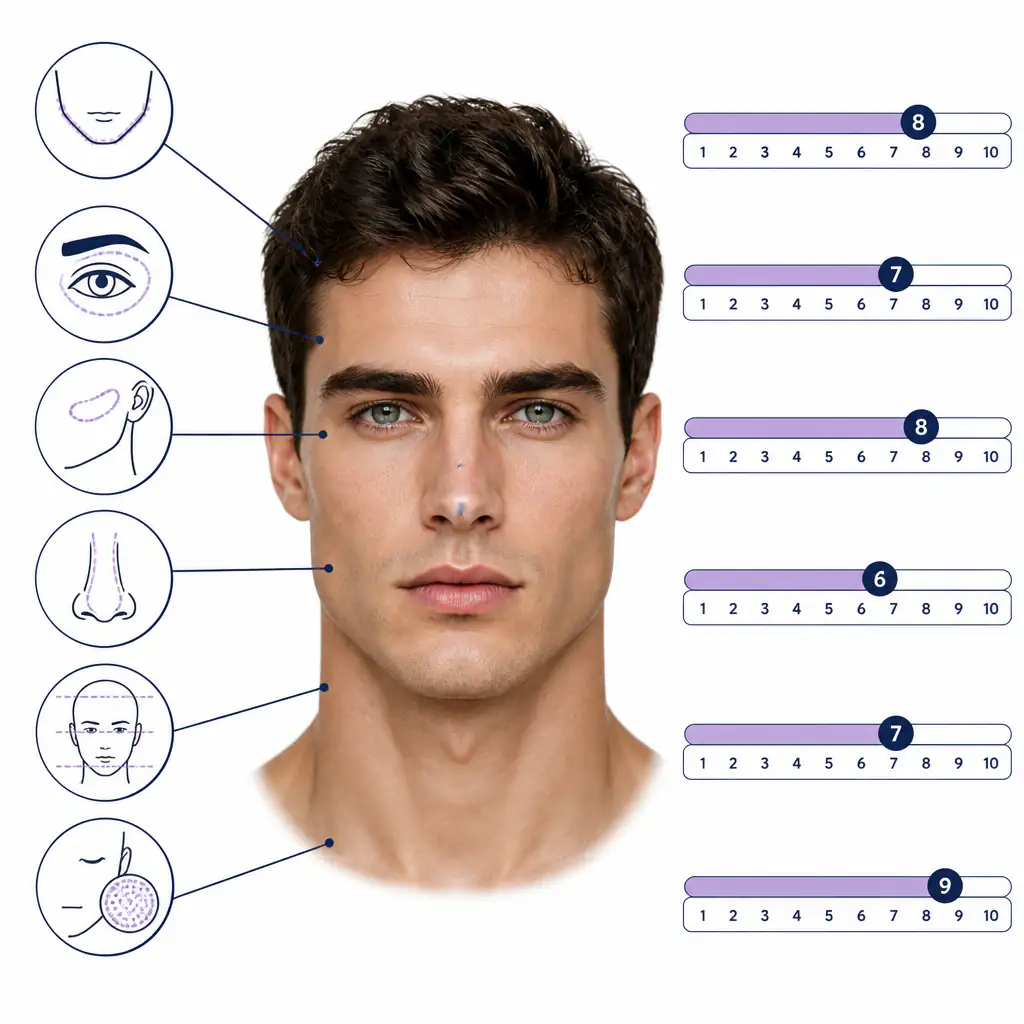
If you’ve spent any time researching male facial aesthetics, you’ve probably encountered a looksmaxxing chart. These charts attempt to break down physical attractiveness into measurable components, assign numerical scores, and give people a framework for understanding where they stand and what they can realistically change. The concept is more structured than it first appears, and understanding how these charts work can save you from chasing improvements that won’t move the needle while ignoring ones that will.
This guide walks through what a looksmaxxing chart actually measures, how to interpret your position on one, and how to translate that information into a practical improvement plan.
What Is a Looksmaxxing Chart?
A looksmaxxing chart is a structured rating system that scores facial and physical traits on a numerical scale, typically from 1 to 10. The goal is to move beyond vague impressions of attractiveness and identify specific, addressable traits. Rather than saying “I want to look better,” a chart forces you to ask: which traits are holding back my overall score, and which are already assets?
The most widely referenced scoring framework is the PSL scale, which stands for Pepper, Sluthate, and Looksmax, the communities where these rating systems were first formalized. Under this system, an overall score is derived from a weighted combination of individual trait scores. A 5 is considered average. Scores above 7 are considered highly attractive. Below 4 suggests significant room for improvement.
The chart isn’t just a vanity metric. Used correctly, it functions as a diagnostic tool. It tells you where your face is genuinely strong, where it’s weak, and which categories respond best to soft-maxxing (non-surgical methods like grooming, body fat reduction, and styling) versus harder interventions.
What Traits Does a Looksmaxxing Chart Score?
Different versions of the chart vary in detail, but most serious versions evaluate the following trait categories:
Facial Structure
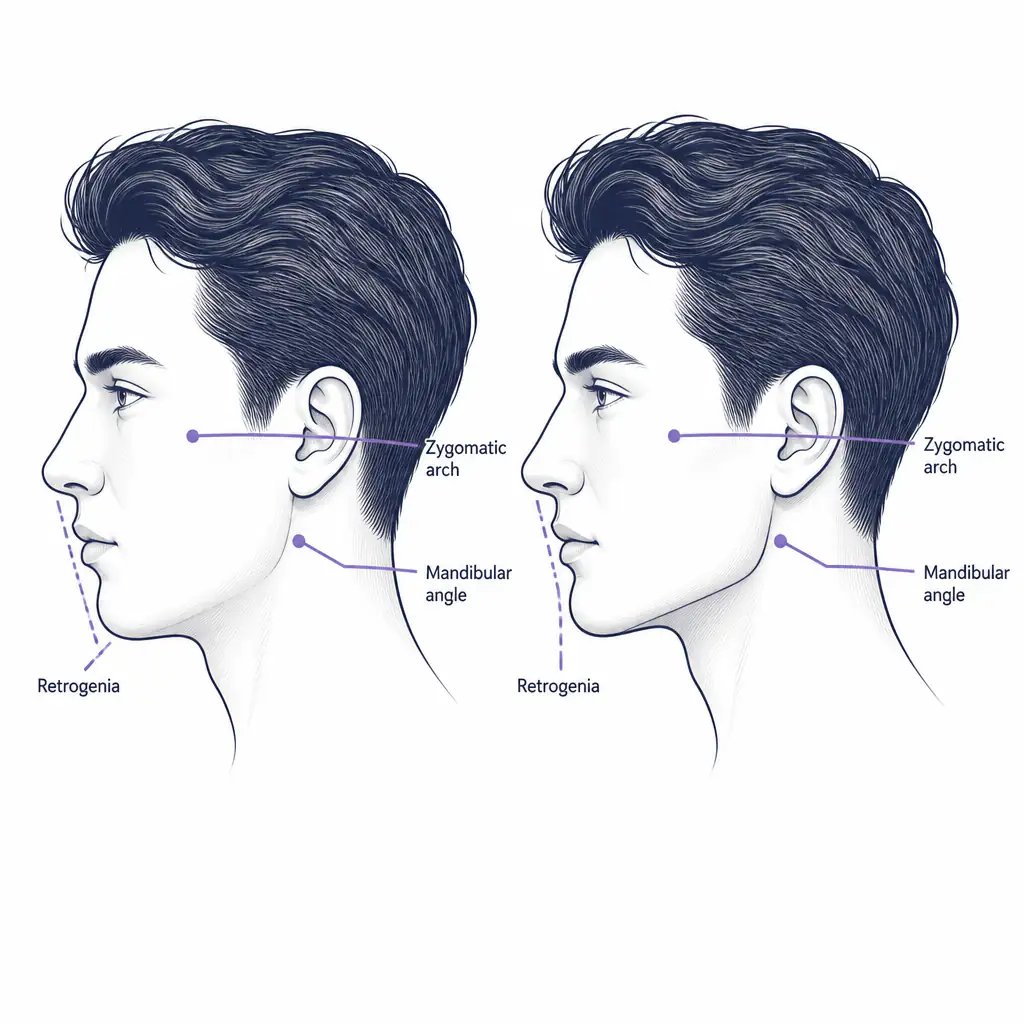
- Jawline and chin projection: A well-defined jaw with forward chin projection scores highly. Weak chin projection (retrogenia) or a soft, undefined jawline lowers the structural score significantly.
- Cheekbone prominence: High, laterally prominent cheekbones (zygomatic arches) contribute to a sculpted midface and score well.
- Orbital structure: The depth and shape of the eye sockets, including the concept of “hunter eyes” (a slight downward cant at the outer corners with a deep-set appearance) versus “prey eyes” (more rounded, exposed sclera), is one of the most discussed traits in PSL-based scoring.
- Facial thirds proportions: The face is divided into three equal horizontal thirds: hairline to brow, brow to nose base, nose base to chin. Even proportions score higher.
Skin and Texture
Clear, even-toned skin with no active acne, scarring, or hyperpigmentation contributes meaningfully to the score. Skin quality is one of the highest-leverage soft-maxxing targets because it responds to consistent skincare routines, diet adjustments, and sleep quality.
Eye Area
Beyond orbital structure, the chart considers canthal tilt (the angle from the inner corner to the outer corner of the eye), eye color contrast, limbal ring visibility, and the presence of dark circles or puffiness.
Nose
Nasal bridge width, tip projection, and nostril flare relative to the intercanthal distance (the space between your inner eye corners) are all scored. A nose that fits within the intercanthal width at its base and has a straight or slightly concave bridge typically scores higher.
Body and Frame (Where Included)
Some versions of the looksmaxxing chart extend beyond the face to include height, shoulder-to-waist ratio, and overall body fat percentage. These traits, while not facial, contribute heavily to overall perceived attractiveness and are often more modifiable than bone structure.
How PSL Scores Are Calculated
Understanding the math behind the chart helps you interpret your score more accurately. Most PSL-based charts don’t simply average all trait scores. Instead, they apply weights based on how much each trait contributes to perceived attractiveness according to research on facial perception.
Rough weight distribution (varies by system):
- Facial structure and bone-related traits: 40-50% of total score
- Skin quality: 15-20%
- Eye area: 15-20%
- Hair and grooming: 5-10%
- Nose and other facial features: 10-15%
This weighting explains why two people can have similarly attractive individual features but score differently overall. A person with a strong jaw, good orbital structure, and poor skin may outscore someone with perfect skin but a weak chin, because structural traits carry more weight.
One important limitation of self-scoring: most people are poor judges of their own features because we see our faces in mirrors, which laterally invert the image, and in photographs that distort proportions based on focal length. A short focal length (typical of front-facing phone cameras) can make the nose appear larger and the jaw narrower than they actually are. This is one reason objective measurement tools, rather than self-assessment, tend to give more reliable baselines.
Aura addresses this by using AI to analyze uploaded photos and return PSL scores, jawline ratings, canthal tilt analysis, and hunter-eye detection, giving you a data point that isn’t filtered through your own perception.
Common Misreadings of the Chart
A few errors come up repeatedly when people first start working with a looksmaxxing chart:
Treating the score as fixed. Facial structure is mostly genetic, but the traits that typically account for 30-40% of your score (skin, grooming, body fat, styling) are highly modifiable. Many people test in the 4-5 range and move to the 6-7 range purely through soft-maxxing.
Over-indexing on a single trait. The chart is a composite. Obsessing over one feature while neglecting others produces diminishing returns. A dramatically improved jawline won’t compensate for poor skin and bad posture.
Ignoring the lighting and photo quality variable. If you’re scoring yourself from selfies taken in harsh overhead lighting with a wide-angle lens, you’re scoring a distorted version of your face. Standardized conditions matter for meaningful comparisons.
Conflating soft-max ceiling with overall ceiling. The chart gives you an overall score, but your practical target should be your soft-max ceiling, meaning the highest score achievable through body composition, skin, grooming and style. For most people, this ceiling is 1.5 to 2 full points above their current baseline.
How to Use a Looksmaxxing Chart Practically
The chart is only useful if it drives action. Here’s a structured approach:
Step 1: Establish a Baseline Score
Get an honest, standardized assessment of each trait category. Use neutral lighting, a camera at eye level, and multiple angles. If possible, use an objective tool rather than self-rating.
Step 2: Identify Your Lowest-Scoring Modifiable Traits
Cross-reference your scores against what’s actually changeable without surgery. Skin quality, body fat, grooming, and hairstyle are almost always on this list. These are your priority targets.
Step 3: Estimate Your Soft-Max Ceiling
For each modifiable trait, estimate how much improvement is realistically achievable. A person scoring 4/10 on skin may reach 7/10 with a consistent routine over 6-12 months. A person scoring 6/10 on jaw definition may reach 7/10 by reducing body fat and reaching lower body fat percentage.
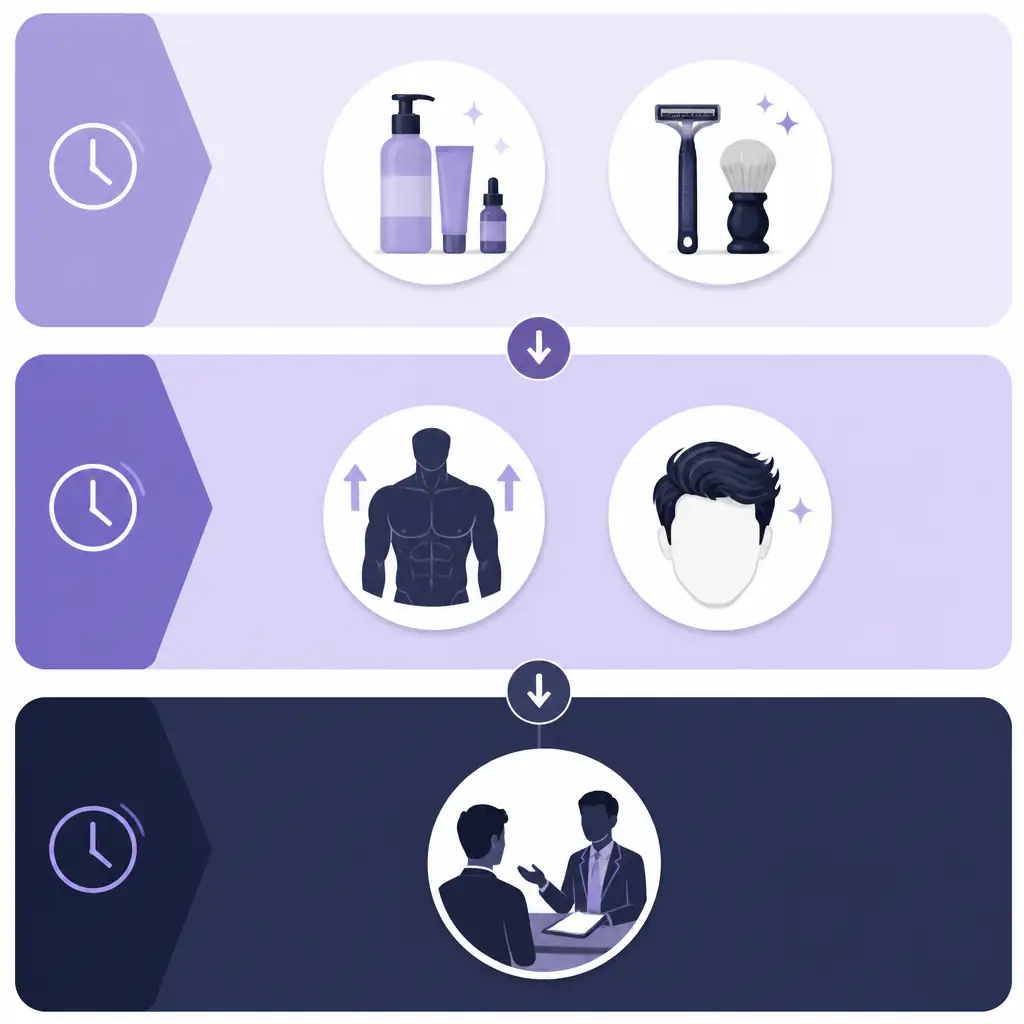
Step 4: Build a Tiered Plan
Organize your improvements into tiers:
- Tier 1 (0-3 months): Skincare routine, haircut optimization, grooming, diet
- Tier 2 (3-12 months): Body recomposition, dental hygiene, mewing practice (research on long-term structural effects is limited and largely anecdotal)
- Tier 3 (12+ months, optional): Consultation with a qualified professional for procedures if structural concerns persist
We don’t recommend surgery or injections to move up the chart. They carry real medical risks, and a number on a chart is not a reason to take them. Skin conditions and bite problems are medical questions for a dermatologist or orthodontist.
Step 5: Re-evaluate Quarterly
The chart is most useful as a progress tool, not a one-time snapshot. Reassess every 90 days with standardized conditions to track real change.
What the Chart Does and Doesn’t Measure
A looksmaxxing chart is a model, and like all models it simplifies reality. It measures static facial traits well, but it doesn’t capture:
- Facial expressiveness and micro-expressions, which research suggests contribute significantly to perceived attractiveness in live interactions
- Voice quality and tonality, which matters considerably in social contexts
- Grooming habits in motion (a haircut that looks great in a photo may not suit your face in motion)
- Context-dependent attractiveness, including how lighting, clothing, and social confidence interact with your features
This doesn’t make the chart useless. It makes it one input among several. People who get the most out of looksmaxxing frameworks are those who use the chart to identify structural priorities and then work on the non-chartable elements in parallel.
If you want a more granular breakdown of where your specific facial features land against PSL benchmarks, Aura provides AI-generated analysis across jawline, orbital area, and overall facial structure, along with personalized improvement suggestions based on your actual score profile.
Soft-Maxxing Targets That Move the Score Most
Based on the weightings discussed above, these are the highest-leverage soft-maxxing interventions relative to scoring impact:
- Body fat reduction: Reduces facial adiposity, sharpens jawline definition, improves cheekbone prominence. Research suggests that for many individuals, losing 10-15 lbs of fat can improve perceived facial attractiveness meaningfully.
- Skincare consistency: A basic routine with a gentle cleanser, moisturizer with SPF, and a retinoid (where appropriate) addresses skin texture and tone, which is one of the highest-weighted soft traits.
- Hairstyle optimization: The right haircut can visually improve facial symmetry and frame the features that score highest. A professional consultation based on your face shape is worth the cost.
- Posture and neck development: Forward head posture compresses the neck and reduces the visual impact of jaw definition. Correcting posture and building the sternocleidomastoid and trapezius muscles frames the face more favorably.
- Eyebrow grooming: Well-shaped brows frame the orbital area and can visually increase the appearance of canthal tilt.
None of these interventions are complex. The challenge is consistency over time, not the difficulty of any single action.
Frequently asked questions
What is a looksmaxxing chart? +
A looksmaxxing chart is a structured scoring system that rates individual facial and physical traits on a numerical scale, typically 1 to 10, to give an overall attractiveness score. It's based on the PSL framework and is used to identify which specific traits to prioritize for improvement.
Is a PSL score accurate? +
PSL scores are a useful framework but not a precise scientific measurement. They reflect community-derived standards of facial attractiveness weighted by trait research. Self-scoring is often inaccurate due to photo distortion and perceptual bias, so using an objective tool or getting external ratings tends to produce more reliable results.
Can you improve your looksmaxxing chart score without surgery? +
Yes, and for most people this is the realistic starting point. Traits like skin quality, body fat level, grooming, hairstyle, and posture are all modifiable without procedures and collectively account for a substantial portion of the overall score. Many people can move their score 1 to 2 points through soft-maxxing alone.
What does "hunter eyes" mean on a looksmaxxing chart? +
Hunter eyes refer to a specific orbital configuration where the outer corners of the eyes sit at or slightly below the inner corners (negative or neutral canthal tilt) and the eyes appear deep-set within the orbital structure. This look is associated with higher attractiveness scores on most PSL-based charts. It is primarily a structural trait, though grooming and body fat can influence how it presents.